Weather forecasts are a daily concern for most people. You want to know whether it will rain or shine tomorrow and in the days ahead, the amount of rainfall, temperature highs and lows, humidity levels, and UV index to prepare necessary plans if you need to go outside. But do we all truly understand the indicators presented in weather forecasts?
Temperature
Temperature is the most familiar and easily understood indicator in weather forecasts. The ideal environmental temperature for the human body is between 20 – 25 degrees Celsius, at which point the body feels most comfortable. If the temperature rises to 33 degrees Celsius or higher, people will feel hot as they absorb additional heat from the environment.

The ideal environmental temperature for the body is between 20 – 25 degrees Celsius.
Forecast agencies typically report on two temperature values: the lowest and highest. The lowest temperature usually occurs at night, while the highest is typically in the afternoon. The highest figure predicts the heat the body may have to endure.
Additionally, some applications provide RealFeel temperature, which reflects the actual outdoor temperature that is often lower or higher than the forecasted value. This discrepancy is usually due to factors such as humidity, wind, and sunlight intensity.
Rainfall
Rainfall is an indicator that indicates the amount of precipitation. It is measured by the amount of rain collected on a flat surface, expressed in millimeters (mm). A rainfall of 1 mm means that 1 square meter of flat ground will collect 1 mm of water after the rain. For example, if 200 mm is recorded, it means that after the rain, the water will be 200 mm deep on 1 square meter of land.
UV Index
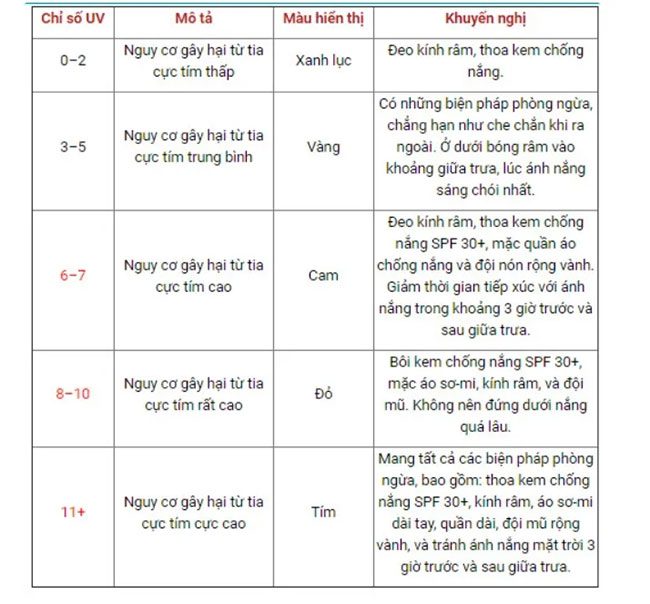
The UV index is an international standard measurement of the intensity of ultraviolet rays reaching the Earth’s surface. This index aims to advise individuals to take protective measures against sun exposure, especially on sunny days or for those who work outdoors and are frequently exposed to sunlight.
The UV index is calculated on a scale from 1 to 11+, displayed in colors ranging from green to yellow, orange, red, and purple, with each color accompanied by specific recommendations.

Humidity Index
Humidity is a physical quantity that indicates the amount of water vapor present in the air. It is an important characteristic of the weather and climate in various regions. Humidity is divided into two types: absolute humidity and relative humidity.
Absolute humidity is measured in milligrams of water per cubic centimeter of air. Relative humidity is expressed as a percentage; for example, a relative humidity of 100% means the air is saturated with water vapor, reaching the point of condensation.
Higher humidity levels lead to poorer sweating, making the body feel heavy and fatigued, increasing the risk of illnesses like colds and flu. High humidity also promotes the growth of bacteria and mold.
Dew Point Index
The dew point of an air mass is the temperature at which the water vapor in the air condenses into liquid water. Specifically, the dew point is the temperature at which the relative humidity of the air mass reaches 100%. When relative humidity is high, the dew point will be close to the current air temperature; conversely, if relative humidity decreases, the dew point will be lower at the same temperature.
Air Quality Index

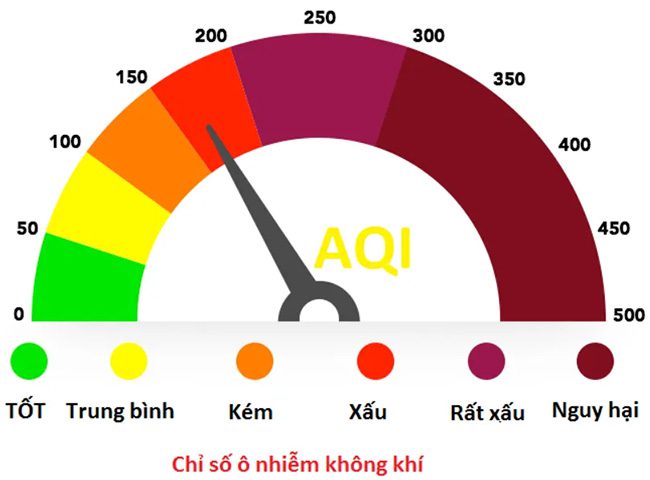
Applications like Zalo often include the Air Quality Index (AQI), which indicates the level of air pollution. This is also an important indicator, especially in large cities. AQI measures how clean or polluted the air around us is and to what extent it is polluted.
The U.S. Environmental Protection Agency (EPA) calculates the AQI based on five main air pollutants: ground-level ozone; particulate matter; carbon monoxide (CO); sulfur dioxide (SO2); and nitrogen dioxide (NO2).
The EPA has designated specific colors for each AQI range to help people easily understand the levels and take protective measures for themselves and their loved ones.


