NASA’s New Graphics Reflect the Path of Tiny Microplastics Circling the Oceans Across Earth’s Surface
Plastic waste circulates through ocean currents. (Graphic: NASA).
Researchers are using NASA’s satellite data to track the movement of microplastics, plastic particles with a diameter of less than 5 mm. Their graphics show high microplastic density in the South China Sea and the Gulf of Thailand, as well as along the western coast of Central America.
Plastic that spills into rivers or is swept away by tides at beaches circulates through ocean currents before drifting across vast seas. Plastic objects break down due to waves and sunlight into tiny microplastics, which marine animals may mistake for food. Eventually, plastic waste accumulates in the centers of oceanic gyres or subtropical gyre systems, which are large circular current systems in the five oceans. The five subtropical gyres around the world contain numerous garbage patches, including plastic waste, fishing lines, and various other debris. The Great Pacific Garbage Patch, located between California and Hawaii, is the most famous due to heavy maritime traffic.
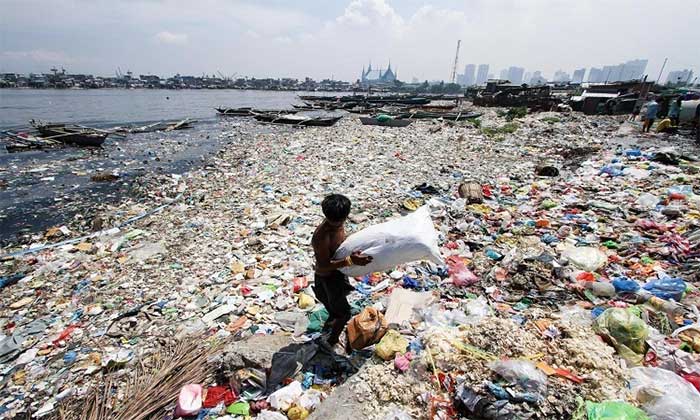
Microplastic density in the ocean varies by location.
Approximately 8 million tons of plastic flow from rivers and beaches into the oceans each year, according to NASA. The graphics created by researchers at the University of Michigan are detailed in the IEEE Xplore journal. “Microplastic density in the ocean varies by location, being particularly high in the North Atlantic and North Pacific gyres. We have developed a new method to detect and photograph the distribution of microplastics in the oceans globally from space,” the research team stated.
The graphics depict the location and density of floating plastic from April 2017 to September 2018. Microplastic density shows seasonal variation. For example, in the Great Pacific Garbage Patch, microplastic density appears to be higher in summer and lower in winter. This is likely due to the ocean’s “vertical mixing” process when temperatures are lower. This process involves the upward and downward movement of air or seawater, caused by temperature differences between water layers.
Scientists estimate the amount of debris in ocean garbage patches through net towing behind ships. However, this sampling method does not indicate how plastic density changes over time. Therefore, the research team at the University of Michigan developed a new method to map microplastic density in the oceans worldwide. They used data from eight microsatellites belonging to the Cyclone Global Navigation Satellite System (CYGNSS).
The $157 million CYGNSS project, launched in 2016, primarily aims to improve storm forecasting. Radio signals from GPS satellites reflect off the ocean surface, and CYGNSS satellites detect that reflection. The research team can then analyze the signals to measure sea surface variability. The measurement results provide them with a means to calculate wind speeds and study storms, but the signals also reveal the presence of plastics. When plastics or debris are near the ocean surface, the sea is less turbulent. This new method allows for monitoring microplastics in the oceans and supports the development of future models.
