Scientists have created a high-resolution global map that predicts human population changes from now until 2025.
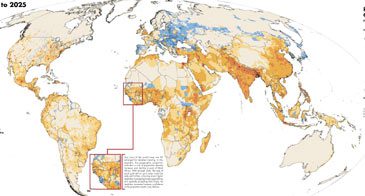
The Future Map project—a collaboration between Columbia University (USA), Hunter College, and the Population Action International organization—differs from traditional population density maps by extrapolating population data for each grid cell in the 9 million cells across the Earth, rather than forecasting the number of people in each country.
 |
|
The map illustrates projected future population changes based on a new model. It predicts population growth in coastal areas, where scientists are concerned about the impact of rising sea levels in the coming decades. (Photo: Discovery, VNE) |
This map could be an essential tool for anyone needing to know where people will live and in what numbers, from conservationists to meteorologists, ecologists, and economists.
The research team, led by Stuart Gaffin, developed the map using data from two sources: population distribution forecasts for 1990 and 1995, and United Nations predictions for 2025.
The scientists constructed two models and input the data from 1990 and 1995 into them. The models calculated population forecasts for each cell among the 9 million grid squares, referencing the national forecast values for 2025 from the United Nations.
Ultimately, the research team selected the most reliable forecasts from each model for each country.
The final results indicate widespread population growth in developing countries. Additionally, the number of people living within 90 kilometers of the coastline is expected to rise to 2.75 billion, a 35% increase since 1995.
“With increasing concerns about rising sea levels and the intensity of storms due to global warming, forecasts like this will be crucial for policymaking and studies on vulnerability,” Gaffin stated.
The map also reveals a significant decrease in population density across much of Japan, Southern Europe, and Eastern Europe.
These results have been well-documented through population analysis, Gaffin noted, but the new map places the changes in a purely geographic context.
T. An
